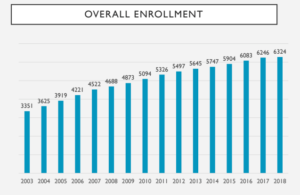
The St. Michael-Albertville school district has had a remarkable streak of growth since the two towns began shifting from rural communities to exurban cities during the 1990s. However, the district’s rapid growth rate looks to be slowing down at least through the 2020-21 school year.
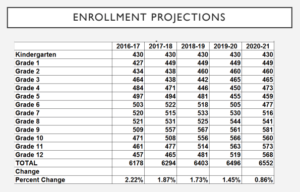
School district superintendent Dr. Ann-Marie Foucault laid out all this information during last Monday’s enrollment report to the school board. She said STMA grew between 7.1 and 8.1 percent per year from 2004 through 2007, then growth slowed somewhat to between 3.6-4.6 percent annually from 2008-2012. 2013 marked the first year that growth fell below 3 percent annually, but the pace continued all the way until 2017, when the district grew 1.25 percent over last year. The future calls for more growth, but at a slower pace: between .86-1.8 percent per year.


The district’s growth fell just shy of demographer projections for the current school year, with a current total of 6,279 K-12 students compared with the projected 6,294. However, the number is higher than the district’s own conservative estimate of 6,212, which they made due to uncertainty over how many families may choose to attend Otsego’s new E-8 school that opened this fall. As it turned out, the district had almost no existing families switch from STMA to Otsego’s new Prairie View school. Projections call for a K-12 student population of 6,552 by the 2020-21 school year.
“So far, what they said would happen is happening,” Foucault said of the demographer’s report.
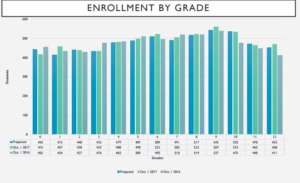
The big population bubble of students is now between grades 4-10, each of which has a class size of 480 or above, with grades 6-10 all having over 500 students and grade 5 just two students shy of 500. Grades 3 and below are notably smaller, between 415-457 students each. This year’s kindergarten class is the smallest in the entire district at 415.

Blue bars shows projected enrollment, green bars show numbers as of Oct. 1 of this year, gray bars show numbers from this time last year.
Special Populations
The school district is slightly more diverse than ever before, with 2017 marking the first year the percent of Caucasian students dipped below 90 percent. Currently 88.82 percent of students are Caucasian. Despite the slight increase in diversity there has also been a small dip in the percentage of English Language Learners in the district, which fell to 1.61 percent in 2017 compared with over 2 percent each of the three years prior to that.
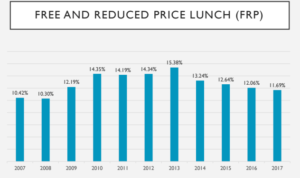
Another special population that shrunk slightly last year was the number of students receiving free and reduced lunch. The district’s percentage of students receiving free or reduced lunch peaked in 2013 at just over 15 percent of students, but the number has fallen steadily in the years since and now sits at 11.69 percent.

The open enrollment population has continued to grow despite Otsego’s new E-8 school’s opening, with 994 total open enrolled students for this school year compared with 861 last year.
One other special population the district tracks is its special education population, which rose last year to 9.18 percent. The previous three years all had special education rates around 8.5 percent of the student population.Foucault said this is the lowest percentage of special education out of the four school districts that make up their special ed. co-op.